Weather Links
METAR
METAR = Meteorological Terminal Aviation Routine Weather Report
METARs tell us the current weather (at least as of the reporting time) at a particular location. Not all airports report METARs.
KBNA 231753Z 19010G16KT 10SM FEW055 BKN230 27/11 A2986 RMK AO2 SLP106 T02670106 10272 20133 58013
Height
- Cloud bases reported with three digits in hundreds of feet AGL
- "SCT020" - scattered at 2000 ft
| Contractions for Sky Cover | |
|---|---|
| SKC | Clear (CLR) |
| FEW | few<= 2/ 8 |
| SCT | scattered - 3/8-4/8 |
| BKN | broken - 5/8-7/8 |
| OVC | overcast - 8/8 |
| VV | vertical vis (indefinite ceiling) - 8/8 |
| Descriptor | Meaning | |
|---|---|---|
| MI | shallow | |
| BC | patches | |
| DR | low drifting | |
| BL | blowing | |
| SH | showers | |
| TS | thunderstorm | |
| FZ | freezing | |
| PR | partial | |
| Precip | ||
| GR | hail >= 1/4 inch | |
| GS | hail < 1/4 inch | |
| UP | unknown | |
| Obscurations | ||
| BR | mist | |
| FG | fog | |
| Other | ||
| SQ | sudden increase in wind speed of at least 16 knots | |
| +FC | tornado or waterspout | |
| FC | funnel cloud |
Weather Begins/Ends
"RAB05E30SNB30E45" - rain began at 5 mins past hour and ended at 30 mins past hour, snow began at 30 mins past hour, ended at 45 past
"TSB05E45" - Thunderstorm began 5 mins past hour and ended 45 mins past hour
TAF - Terminal Aerodrome Forecast
- Concise statement of expected meteorological conditions within 5 SM radius from airport during 24 hour time period
- Routine TAFs valid for 24 hours and are issued four times daily at 000Z, 0600Z, 1200Z, 1800Z
KLIT 231736Z 2318/2418 18010KT P6SM SCT020 OVC110
TEMPO 2318/2319 VRB15G25KT 3SM TSRA BR BKN015 OVC025CB
FM231900 17010G20KT P6SM OVC040
TEMPO 2319/2323 3SM TSRA BR SCT015 OVC025CB
FM232300 19012G22KT 4SM TSRA BR SCT020 OVC040CB
TEMPO 2323/2403 30015G35KT 1SM +TSRA BR BKN009CB OVC025
FM240300 19008KT P6SM OVC060
TWEB - Transcribed Weather Broadcast
- Provides continuous aeronautical and meteorological info on low/medium freq (LMF) and very high freq (VHF) omni-directional radio range (VOR) facilities
- Content: Intro, Synopsis, Adverse conditions, Route forecasts, Winds aloft forecast, Radar reports, METARs, Density Altitude, PIREPs, Alerts, Closing statement
- Synopsis is brief description of weather systems affecting route during forecast period, describe movement of pressure systems, fronts, upper air disturbances, or air flow
TIBS - Telephone Info Briefing Service
- Provided by AFSSs and provides continuous telephone recordings of meteorological and/or aeronautical info
- Contain area and/or route briefings, airspace procedures, special announcements
- Contain METARs, TAFs, winds, temps aloft
- TIBS service is 24 hrs/day
SIGMETS
- Forecast period is 4 hours
- Advises of non-convective weather potentially hazardous to all aircraft
- Identified by alphabetic designator from November thru Yankee excluding Sierra, Tango and Zulu (reserved for AIRMETs)
- Issued when following occur:
- Severe icing
- Severe or extreme turbulence
- Dust storms or sandstorms
- Volcanic ash
Convective SIGMET (WST)
- Severe thunderstorm due to: surface winds more than 50 knots, hail, tornadoes
- Embedded thunderstorms
- Line of thunderstorms
- Thunderstorms producing precipitation affecting 40% or more of area at least 3,000 sq miles
AIRMETS
- Describe significant weather conditions at intensities lower than those required for SIGMETs
- Scheduled basis every 6 hours beginning at 0145 UTC
- AIRMETs contain details about IFR, extensive mountain obscuration, turbulence, strong surface winds, icing, freezing levels
- Three types:
- Sierra- describes IFR conditions
- Tango - moderate turbulence
- Zulu - moderate icing
Winds / Temps Aloft
- Forecasts are made twice daily at 00Z and 12Z based on radiosonde data
- "TEMPS NEG ABV 24000" - temps above 24,000 feet are always negative
- Up to 12,000 feet, levels are true altitude - from 18,000 feet levels are pressure altitude
- 4 digits: first two are wind direction in tens, second 2 are wind speed in knots
- "2426" = wind from 240 at 26 knots
- "2826-14" = wind from 280 at 26 and temp is -14C
- If wind group omitted, no winds were forecasted
- If wind direction coded between 51 and 86, wind speed is 100 knots or greater
- "731960" - subtract 50 from wind dir, add 100 to wind speed = 73-50 = 230 degrees, 100+19 = 119 knots
- If wind speed forecasted to be 200 knots or greater, coded as 99 knots
- "7799" decoded as 270 degrees at 199 knots or more
- 9900+00 = wind light and var, temp 0C
PIREPs
UUA /OV ORD/TM 1235/FLUNKN/TP B727/TB MOD/RM LLWS +/-20KT BLW 003 DURD RWY27L
Urgent, over Chicago Ohare Airport at 1235Z. Flight level (FL) unknown, info from a type (TP) Boeing 727. Turbulence was moderate on descent to runway 27 left, low-level wind shear (LLWS) detected below 300 ft.
RADAR Reports
GRB 1135 AREA 4TRW+ 9/100 130/75 50W C2425 MT 310 at 45/47 AUTO
Green Bay, WI automated report at 1135 UTC. Area of echoes of 4/10 coverage, containing thunderstorms (TRW) and heavy rain showers. Area defined by points (referenced from GRB radar site) at 9 degrees, 100 nm and 130 degrees, 75 nm. Width of area is 50 nm (25 nm either side of center line). Cells moving from 240 degrees at 25 KT. Max top (MT) is 31000 ft MSL located at 45 degrees and 4 NM from GRB.
Surface Analysis Charts
- Computer-generated chart with frontal analysis by HPC (Hydrometeorological Prediction Center) forecasters
- Transmitted every 3 hours covering 48 states and adjacent areas
- Provides ready means of locating pressure systems and fronts, overview of winds, temps, and dew point temps
From OverTheAirwaves:
What is primary advantage of surface analysis charts to the GA pilot?
Unlike other weather products, the surface analysis gives us the "big picture" in a glance. High pressure areas signal good weather; low pressure areas portend bad weather. Fronts denote areas of likely unsettled and often turbulent weather. Occluded and stationary fronts suggest longer periods of disturbed weather.
If we were to zero in on just one element contained in a surface analysis chart, what should that element be?
Answer: Where is the "L?" The "L," of course, means "low pressure." Sometimes called "the toilet bowl" of the nation's weather system, a low pressure is typically associated with lower visibility, drizzling rain, and generally poor weather. These are areas to avoid whenever possible.
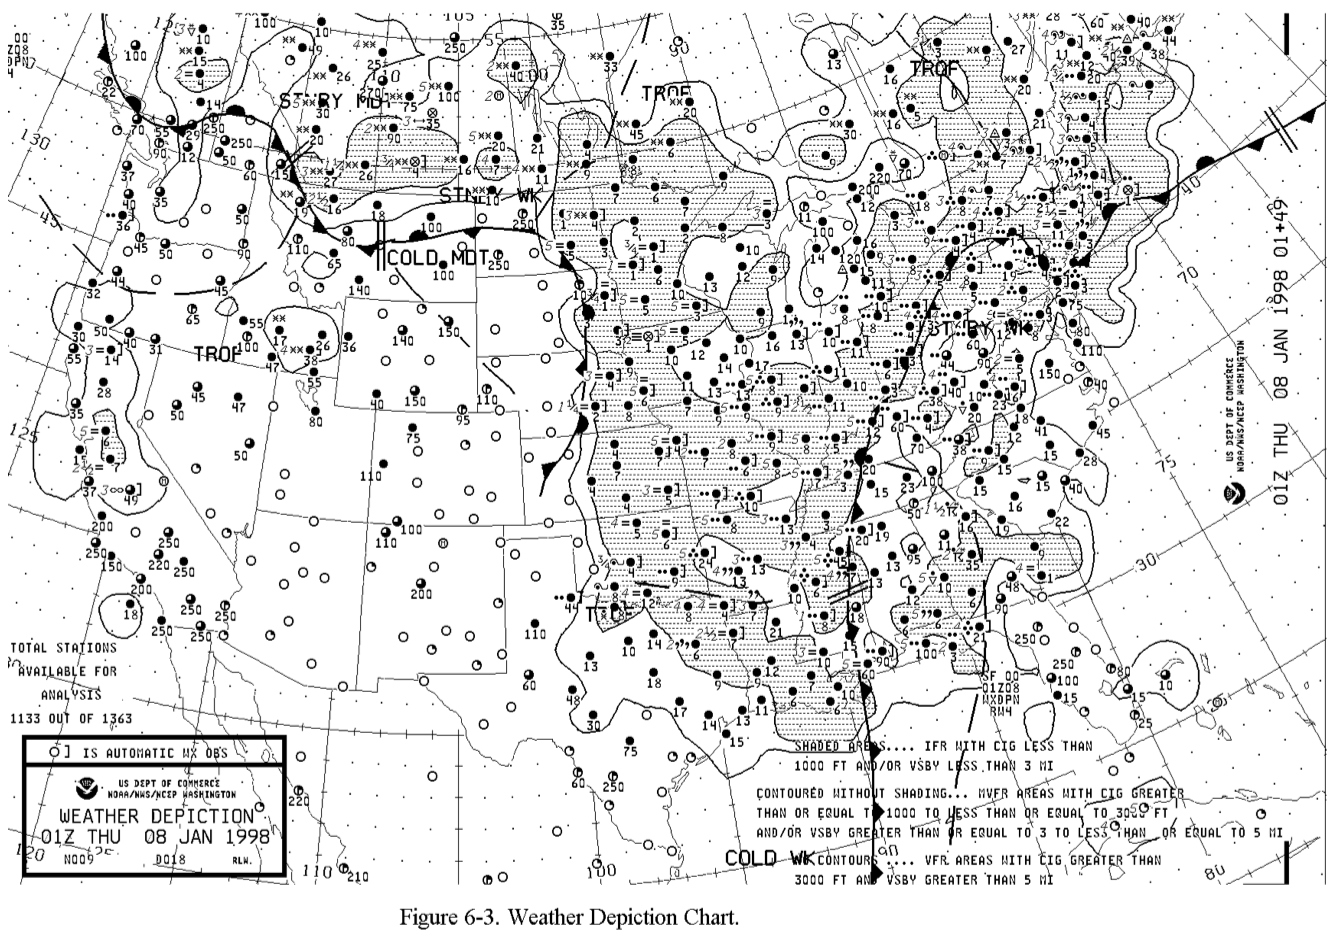
Weather Depiction Chart
- Computer-generated (with human frontal analysis) from METAR reports
- Transmitted every 3 hours covering 48 states and adjacent areas
- Indicates total sky cover, cloud height or ceiling, weather and obstructions to vision, and visibility
- Cloud height AGL in hundreds of feet, same as METAR
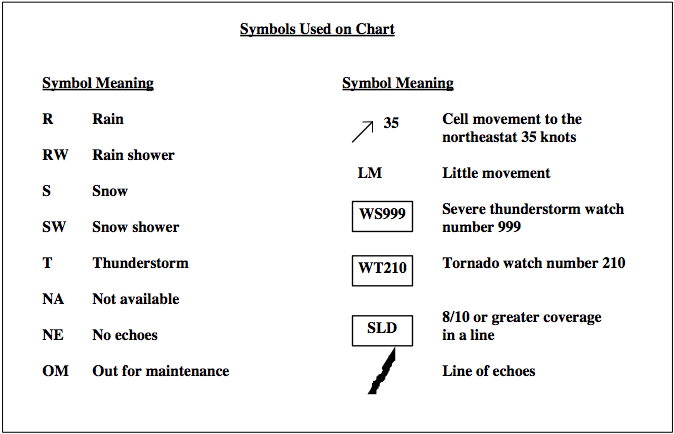
Click here for chart symbol legend.
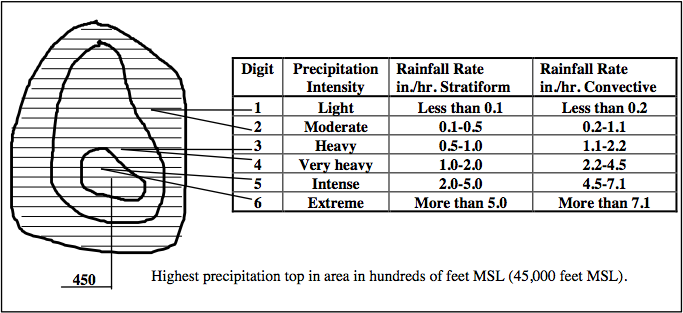
Radar Summary Charts
- Computer-generated graphical display of collection of auto radar weather reports (SDs)
- Displays area of precipitation as well as info about type, intensity, config, coverage, echo top, and cell movement of precipitation
- Chart available hourly
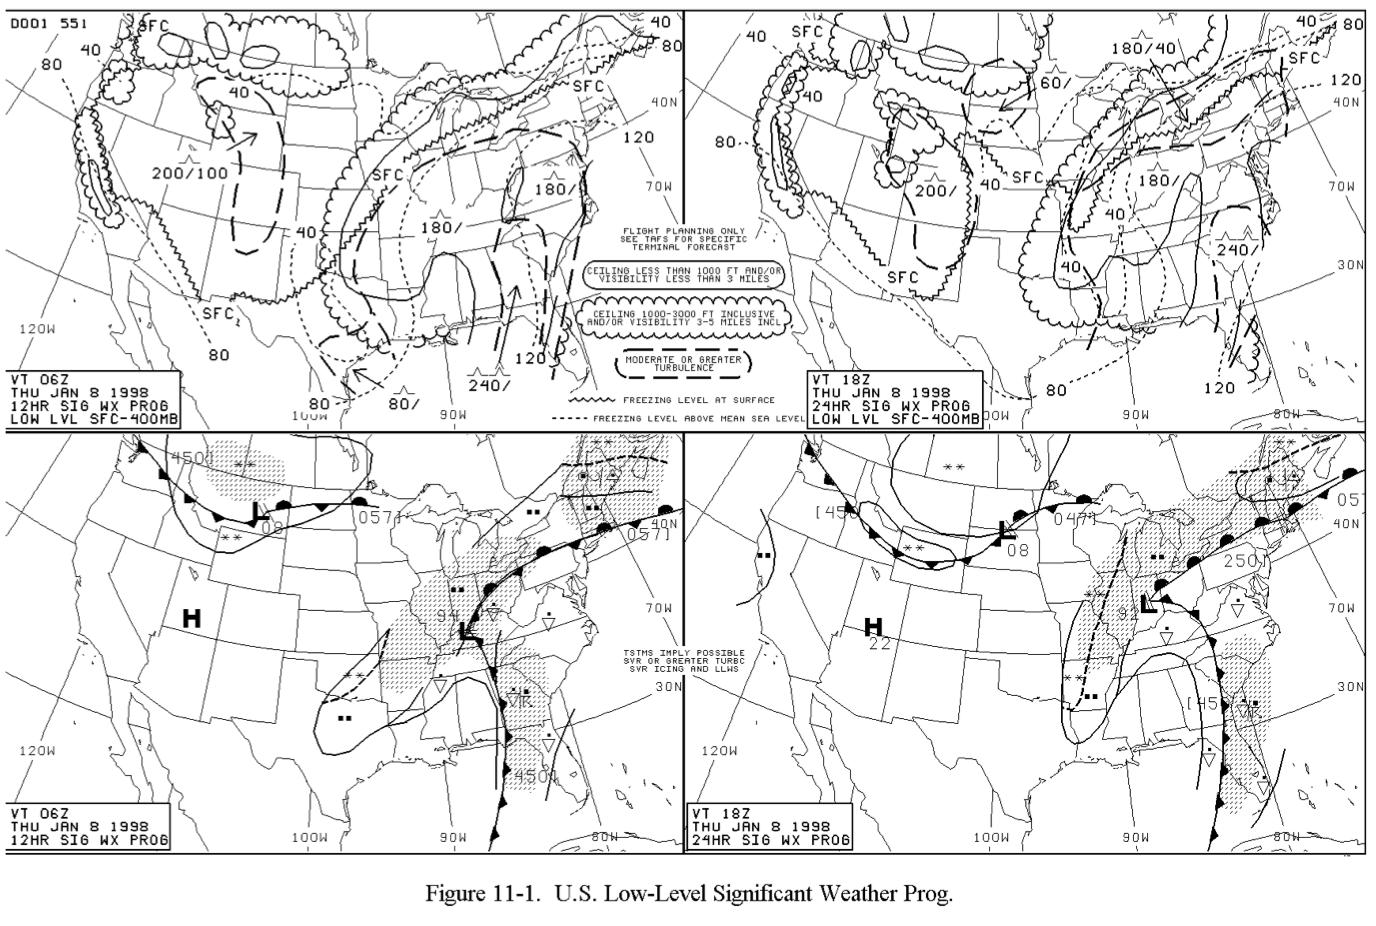
Significant Wx Prognostic Charts
- Portray forecasts of selected weather conditions at specified valid times
- Chart composed of 4 panels
- Two lower panels depict 12 and 24 hour surface prognostic charts that are produced at HPC (Hydrometeorological Prediction Center) in Camp Springs, MD
- Upper two panels depict 12 and 24 hours significant weather prognostic charts produced at AWC in KC, MO
- Display forecast weather flying categories, freezing levels, turbulence for layer surface to FL240
Displays:
- Precipitation - enclosed by solid lines, solid precipitation is shaded
- Weather Flying Categories - IFR enclosed by solid lines, MVFR scalloped, other VFR
- Freezing level - thin, short dashed lines labelled in hundreds of feet
- Turbulence - Moderate or greater enclosed by bold, long dashed lines
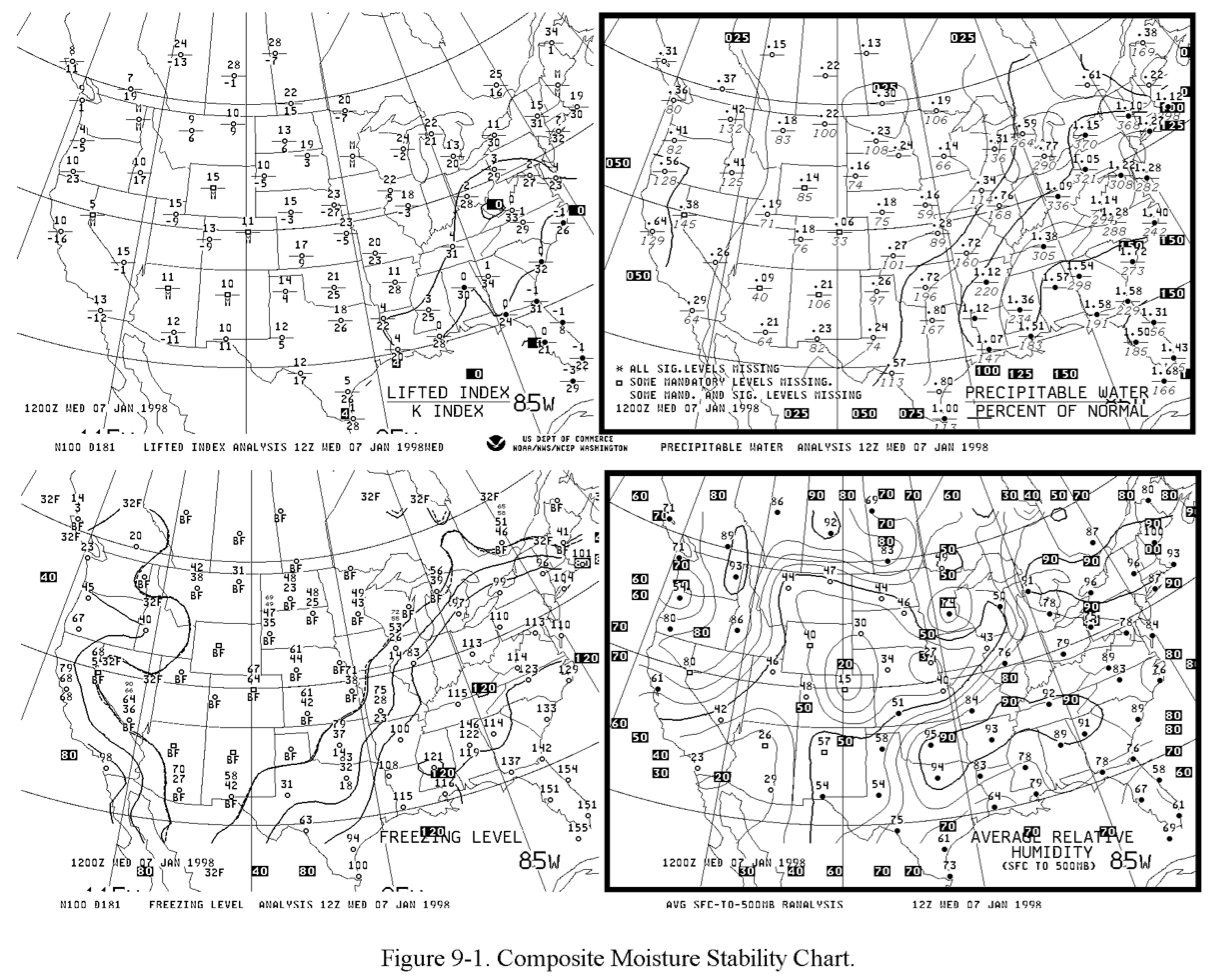
Composite / Stability / Freezing Charts
- Chart composed of four panels which depict stability, precipitable water, freezing level and average relative humidity
- Issued twice daily at 00Z and 12Z
1. Stability Panel
- Upper left panel of chart
- indexes are the K index (KI) and lifted index (LI)
- K Index (KI)
- Provides moisture and stability info, plotted below station symbol
- High positive KI signifies moist unstable air (+20 or more)
- Low or negative KI implies dry stable air (less than +20)
- KI is indicator of probability of thunderstorms
- Higher KIs imply higher probabilities
- Lifted Index (LI)
- Common measure of atmospheric stability, plotted above station symbol
- Positive LI means lifted surface parcel of air is stable
- Negative LI means lifted surface parcel is unstable
- Station circles are blackened for LI values of zero or less
- Low and negative LIs indicators of intensities of thunderstorms
2. Precipitable Water Panel
- Upper right panel of chart, analysis of quantity of water vapor in atmosphere from surface to 500mb (18k ft MSL)
- Precipitation water values are plotted above each station symbol to nearest hundredth of an inch
- Percent relative to normal for month plotted below station symbol
- Black circles indicate stations with precipitation water values of 1.00" or more
- Isopleths of precipitation are drawn and labeled for every 0.25"
- ".72/1966" indicates that 72 hundredths of an inch of precipitation present, which is 196% or normal for any day during this month
3. Freezing Level Panel
- Lower left panel of composite moisture stability chart
- Freezing level is height above MSL at which temp is 0C
- During very cold periods, all temps over station may be below freezing and there would be no freezing level
- Stations may have more than one freezing level
- Observed freezing levels are plotted on chart in hundreds of feet MSL
- BF is plotted on chart to indicated below-freezing temps at surface
4. Average Relative Humidity Panel
- Lower right panel of composite moisture stability chart
- Relative humidity is ratio of quantity of water vapor in sample of air compared to air's capacity to hold water expressed in percent
- Air's capacity to hold water vapor depends primarily on its temp and pressure
- Warm air can hold more water vapor
- Air at lower pressure can hold more water vapor
- Upward motion increases relative humidities and downward motion decreases relative humidities
- Air with high relative humidities often contain clouds and may product precip
- Blackened circle indicate stations with humidities of 50% of higher
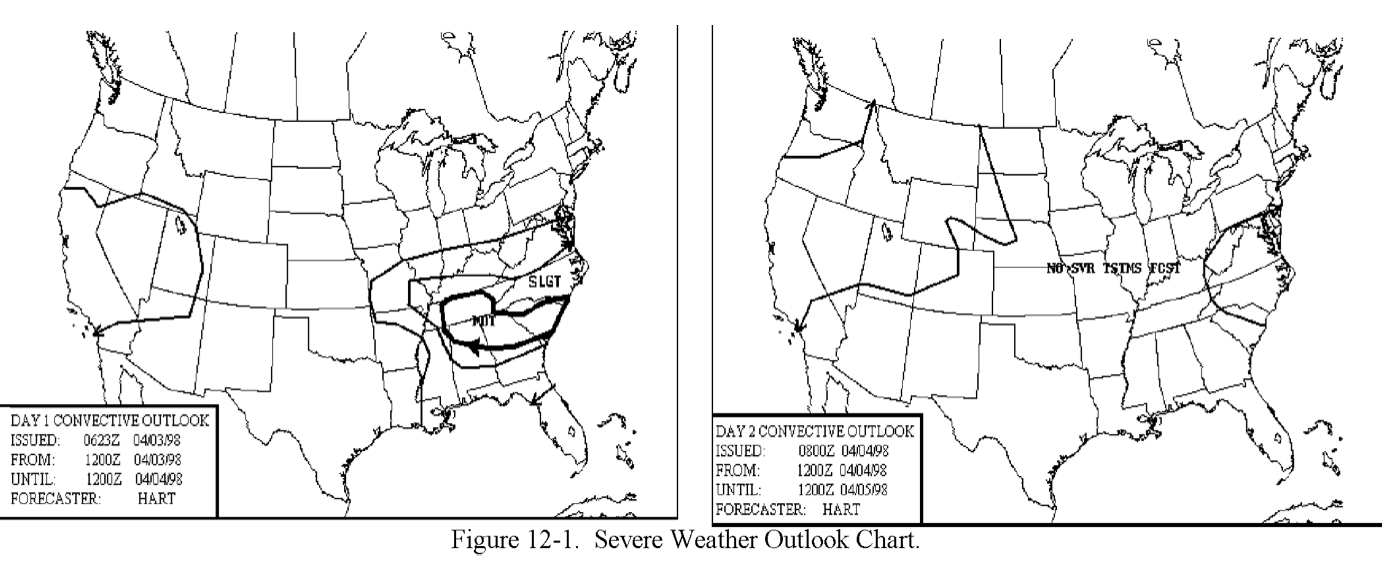
Severe Weather Outlook Charts
- Delineates areas forecast to have thunderstorms
- Left panel is Day 1 Convective Outlook and right panel is Day 2 convective outlook
- Day 1 is issued 5 times daily
- SLGT - slight implies well-organized severe thunderstorms are expected but in small numbers
- MDT - moderate risks imply greater concentration of severe thunderstorms and in most situations greater magnitude of severe weather
- HIGH - high risk almost always means major severe weather outbreak